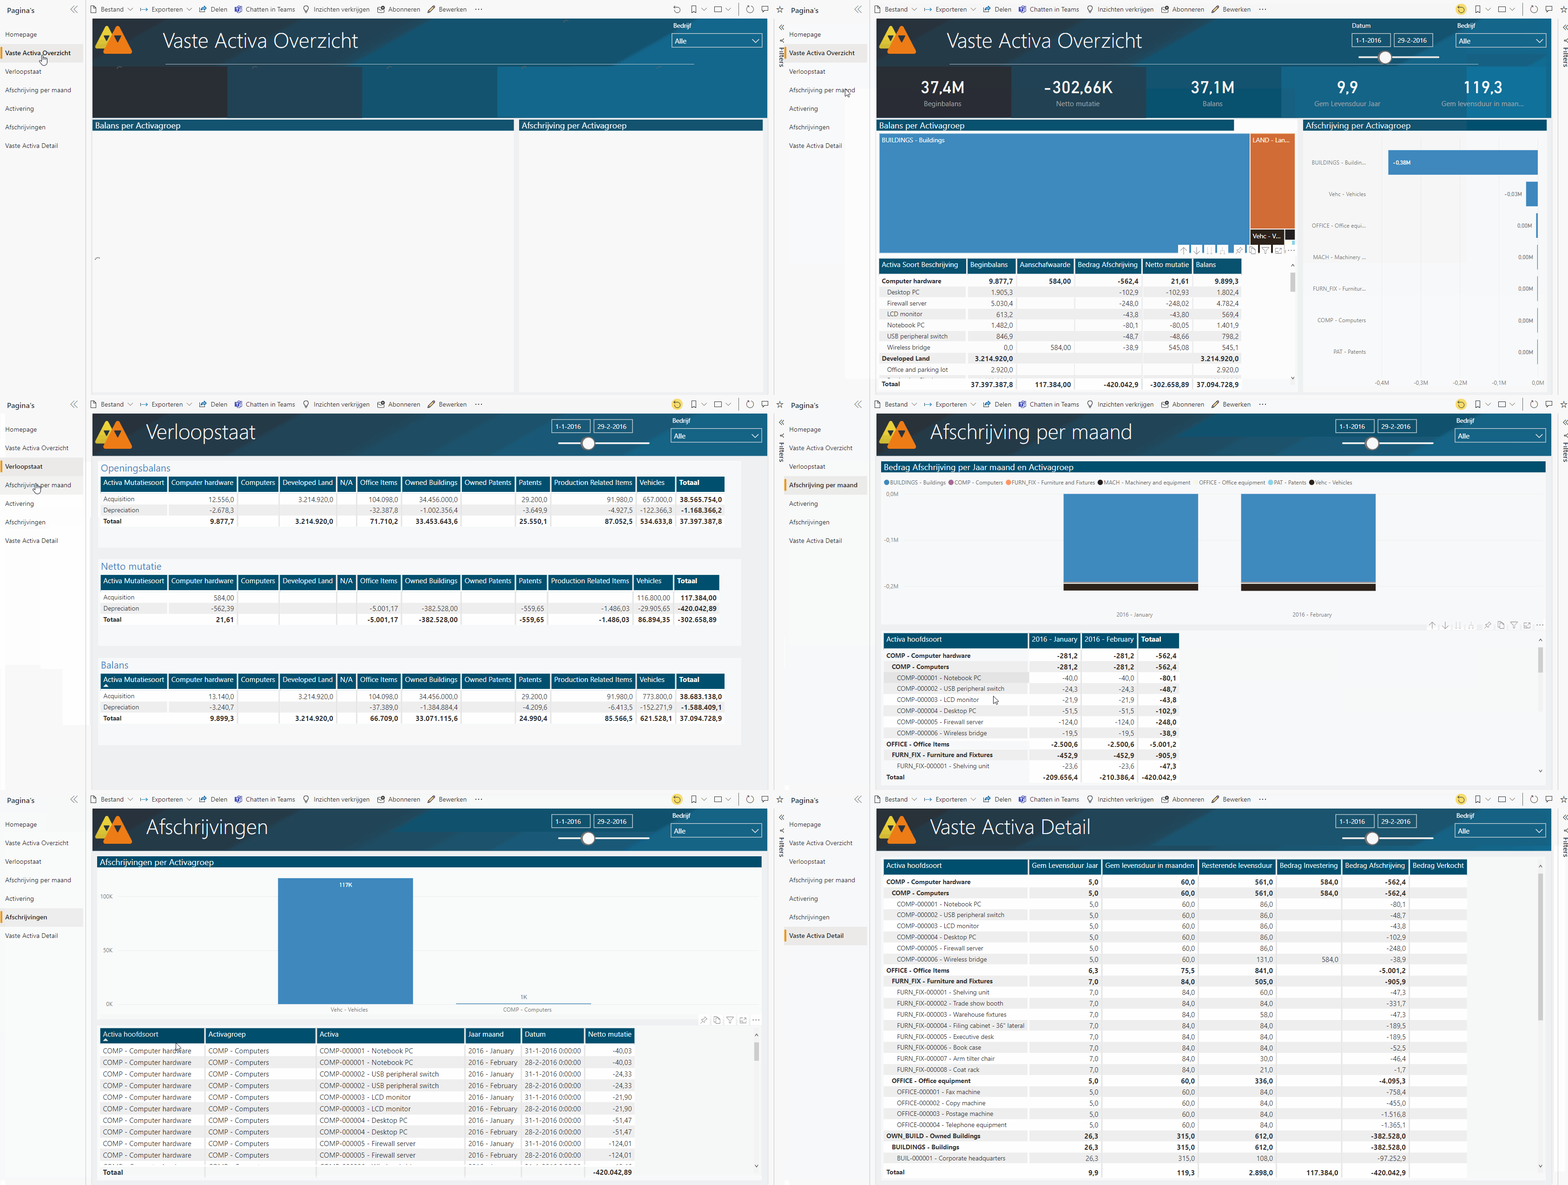
Dynamics 365 Power BI dashboards
Data storytelling is the practice of building a narrative around a set of data and its accompanying visualizations to help convey the meaning of that data in a powerful and compelling way.
As BIRDS works with Power BI as its frontend, it is easy to build a custom User Experience (UX) for the data storytelling you want.
This way of visualization is great on a big display in your headquarters or a great data story for the management report meetings.
Power BI dashboards with BIRDS data platform
On this dashboard you see how the organization performs on the indicators you selected, you can spot trends and progress in projects and other complex, multi-disciplined areas. You also can highlight patterns and connections in a certain context.
This User Interface combines the best way to visualize your data based on the different indicators most companies want to see. As a dashboard template is included in BIRDS this is not mandatory, if you want to setup the UI of your performance dashboard in Power BI in an own / different UI/UX your free to do so.

Van Bommel customer case: Data insights in just 5 weeks
During 2021 the new Microsoft Dynamics ERP system has gone live at van Bommel and the necessity of an BI reporting system arised. Instead of building an custommade Data Warehouse, Van Bommel chose Microsoft Power BI and BIRDS to extract the Dynamics data and get real insights in Power BI.
In this video, CEO Reynier van Bommel explains the value of BIRDS for their company and why a standard solution is more benifical than a customade BI tool.
